Weather
Osaka's average August night is 25.8°C. That is the number nobody quotes.
Everything written in English about summer in Japan reaches for the same word: humid. But in the Meteorological Agency's own records, the two cities with the worst reputation for it — Kyoto and Osaka — have the lowest relative humidity of any major city in the country. Lower than Sapporo. The reputation is deserved and the number is misleading, and the figure that will actually shape your first summer here is one almost nobody prints.
If you are deciding whether to come to Japan, the weather is not usually what you are researching. You are looking at schools, at money, at visas. Then you land in the second week of August, walk out of the airport at nine in the evening, and discover that the outside air is warmer than the aeroplane cabin was and does not cool down for the next six weeks.
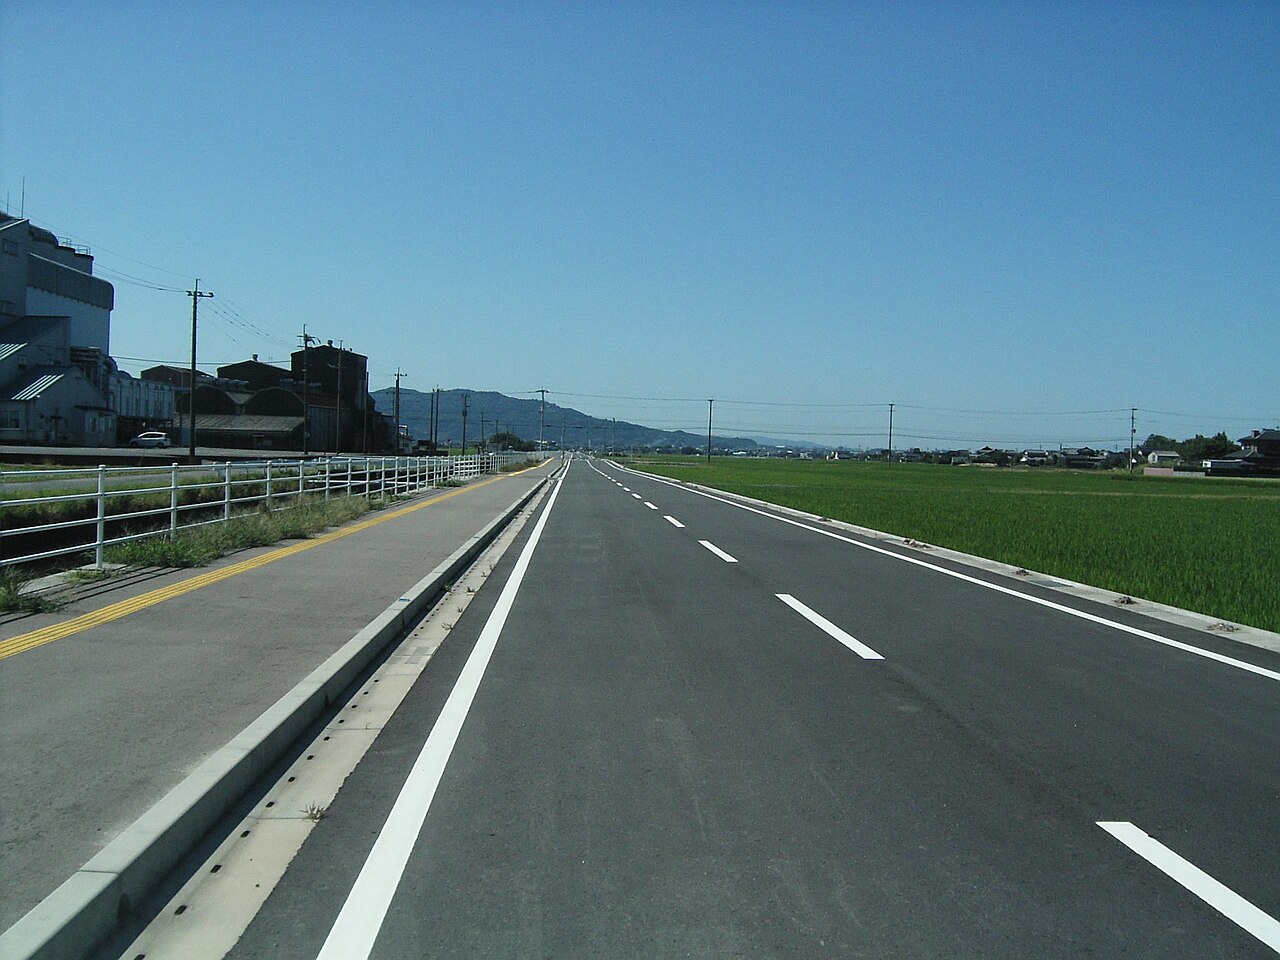
This article is about what the weather records say, and about the one number in them that changes how you should choose a room. Everything here comes from the Japan Meteorological Agency's 1991–2020 normals — the thirty-year averages the agency itself publishes for each observation station.
The humidity figure everyone quotes is the wrong figure
Here is average relative humidity in August, by city. If the story you have read is true — that western Japan is a steam bath and the north is bearable — this chart should sort itself accordingly.
Japan Meteorological Agency, climatological normals for 1991–2020, August, one observation station per city. Kyoto and Osaka are last. Sapporo — the city Japanese people move to in order to escape the summer — is nine points more humid than Kyoto.
That is not a mistake in the data, and it is not a mistake in the reputation either. It is a mistake in the measure.
Relative humidity is a percentage of a moving target. It describes how much water the air is holding as a share of the maximum it could hold at that temperature — and warm air can hold far more. Heat the same air without adding a drop of water and the percentage falls. Kyoto in August is 33.7°C in the afternoon. Sapporo is 26.4°C. The Kyoto air is carrying much more water and reporting a smaller number.
The measure that does not move is dew point — the temperature at which the air would start to condense. It tracks the actual quantity of water in the air, and it is what meteorologists use when they want to say how oppressive it feels.
| City in August | Daytime high | Night low | Rel. humidity | Dew point |
|---|---|---|---|---|
| Sapporo | 26.4°C | 19.1°C | 75% | 17.7°C |
| Sendai | 28.2°C | 21.6°C | 81% | 20.9°C |
| Tokyo | 31.3°C | 23.5°C | 74% | 21.9°C |
| Nagoya | 33.2°C | 24.7°C | 69% | 21.7°C |
| Kyoto | 33.7°C | 24.7°C | 66% | 21.2°C |
| Osaka | 33.7°C | 25.8°C | 66% | 21.8°C |
| Hiroshima | 32.8°C | 25.1°C | 69% | 22.1°C |
| Fukuoka | 32.5°C | 25.4°C | 72% | 22.8°C |
| Naha | 31.8°C | 26.8°C | 78% | 24.6°C |
Notice what happened to the ranking. By relative humidity, Kyoto and Osaka are the driest cities in the table. By dew point they sit near the top, and every city south of Tokyo is carrying more water than Sapporo by a margin of three to seven degrees. Naha, in the far south, is at 24.6°C — air that is close to saturated at body-adjacent temperatures.
The number that decides your summer is measured at night
Look at the third column of that table again — the night low. This is the average minimum temperature across the whole month, so roughly half the nights are hotter than the figure shown.
Osaka's is 25.8°C. Naha's is 26.8°C. Fukuoka, Hiroshima, Nagoya and Kyoto all sit between 24.7 and 25.4°C.
Japan has a word for a night where the temperature never falls below 25°C. It is nettaiya — a tropical night — and it exists as a term because it is tracked and counted. In Osaka, the average August night is one.
This is the number that matters to you, and the reason is not comfort. It is that you cannot sleep through it without air conditioning, and whether your room has air conditioning — and whether you can afford to run it — is a decision you make months earlier, from another country, while looking at a listing that may not mention it.
What this means when you are choosing a room
Two things are worth checking before you sign anything, and both are factual questions with factual answers:
Does the room have an air conditioner already installed? In Japan the unit is often the tenant's responsibility rather than the landlord's, and a room advertised without one may genuinely not have one. Buying and installing a unit is a five-figure yen expense arriving in your first month.
Is the room on the top floor, and does it face west? A top-floor west-facing room takes the afternoon sun through the roof and the wall at once. It is the cheapest kind of room in the building for a reason.
We wrote about how students actually choose rooms — 77.7% by price — in the housing article. Air conditioning does not appear in that survey at all. That is not because it does not matter.
The tropical island is not the hot part
Naha is about 1,500 km south-west of Kyoto, on a subtropical island much closer to Taipei than to Tokyo. Every instinct says it is the hottest place in the table.
Naha, August
Daytime high. Surrounded by ocean, which warms and cools slowly, so the days do not climb — and the nights do not fall. Night low 26.8°C, the highest in the country.
Kyoto, August
Daytime high — 1.9°C hotter than the subtropical island. A basin ringed by mountains on three sides, where the heat that accumulates during the day has nowhere to go.
The pattern in the table is not latitude. It is geography of a smaller kind: whether a city sits on the sea or in a bowl. Kyoto, Nagoya and Osaka — the three hottest daytime cities in the table — are all inland or nearly so, and all three sit in basins or on plains that trap the afternoon.
Which is worth knowing if you are choosing between cities for other reasons and assuming the weather scales with the map. It does not. Cost varies far more by city than school type does; so does this.
Your parents' Japan was three degrees cooler
Tokyo has been recording temperature since 1875, which makes it one of the longest continuous urban records in Asia. We took every August in that record and averaged it in blocks.
| Tokyo, August | 1901–1930 | 1991–2020 | 2016–2025 |
|---|---|---|---|
| Daytime high | 29.7°C | 31.5°C | 32.7°C |
| Monthly mean | 25.4°C | 27.6°C | 28.2°C |
| Night low | 22.0°C | 24.6°C | 24.9°C |
Across a century, Tokyo's August days gained 3.0°C and its nights gained 2.9°C. A hundred years ago the average August night in Tokyo was 22.0°C — a temperature you can sleep in with a window open. It is now 24.9°C, which you cannot.
This is worth saying plainly because of what it does to advice. Anyone describing summer in Japan from their own experience is describing a different climate the further back they went. A guidebook written in the 1990s, a professor remembering their student years, a relative who studied here — all of them are accurate about a country that was measurably cooler at night than the one you will arrive in.
Where this calculation is soft, and how
These block averages are ours, not the agency's. We averaged the published monthly observations directly. The Meteorological Agency's official 1991–2020 normal for Tokyo in August is 26.9°C, while our average of the raw monthly values for the same period is 27.6°C. The difference is not an error in either figure: official normals are adjusted for changes in the observation environment, and Tokyo's station moved in December 2014 from Otemachi to a park at Kitanomaru, about 900 m away and greener.
The direction of that move matters here. The newer site is the cooler one, so a straight average of raw values across the move makes the warming look smaller than a like-for-like comparison would. We have not attempted to correct for it, and you should read the century figures as an approximate floor rather than a precise trend.
If you want the properly homogenised series, the agency publishes it. We are not going to reproduce it badly here and call it ours.
Whether any of this is bad depends on where you are now
Every article about Japanese summers is written as though the reader is coming from somewhere temperate. Most of you are not. Of the 408,069 international students in Japan, the largest groups come from China, Nepal, Vietnam, Myanmar and Sri Lanka — and those five countries do not have the same summer as each other, let alone the same one as Japan.
So here is the comparison, with your city and Japan's on the same scale. The measure is apparent temperature — what the air does to a body once humidity, wind and sun are taken into account — averaged across every August day from 1991 to 2020.
| August, where you might be now | Daytime high | Feels like |
|---|---|---|
| Hanoi, Vietnam | 31.3°C | 38.3°C |
| Taipei, Taiwan | 30.8°C | 37.5°C |
| Dhaka, Bangladesh | 30.9°C | 36.7°C |
| Bangkok, Thailand | 31.4°C | 36.3°C |
| Fukuoka, Japan | 30.5°C | 35.7°C |
| Shanghai, China | 30.8°C | 35.7°C |
| Kyoto and Osaka, Japan | 31.0°C | 35.6°C |
| Jakarta, Indonesia | 30.8°C | 35.3°C |
| Yangon, Myanmar | 29.1°C | 34.4°C |
| Colombo, Sri Lanka | 28.3°C | 33.5°C |
| Tokyo, Japan | 29.7°C | 33.5°C |
| Beijing, China | 30.2°C | 33.2°C |
| Seoul, South Korea | 28.5°C | 32.7°C |
| Kathmandu, Nepal | 25.4°C | 30.2°C |
| New York, United States | 27.6°C | 29.5°C |
| Sapporo, Japan | 24.3°C | 26.8°C |
| Ulaanbaatar, Mongolia | 21.6°C | 20.2°C |
| London, United Kingdom | 21.4°C | 20.2°C |
If you are reading this in Hanoi, Taipei, Dhaka or Bangkok, Japan in August will be a mild improvement and the thing that surprises you will be how few buildings are cooled to the temperature you expect.
If you are reading this in Kathmandu, it will not. Nepal is now the second-largest source of students in Japan — 100,239 of them — and Kathmandu sits at 1,400 m, where August feels 5.4°C cooler than it does in Kyoto. That is the largest gap on this table for any major sending country, and it is the one least likely to be mentioned to you by someone who went before, because the people who warn you about Japanese summers are usually warning the wrong audience.
And if you are coming from Ulaanbaatar or from anywhere in northern Europe, the numbers in the last two rows are not a smaller version of the same weather. They are a different climate, and no amount of preparation from home will be a rehearsal for it.
Why the Japanese figures in this table are lower than the ones above
The table at the top of this article uses the Meteorological Agency's own station observations: Kyoto's August daytime high is 33.7°C. This table says 31.0°C for the same city. Both are correct and they are measuring different things.
There is no single agency publishing station records for Hanoi, Kathmandu and Kyoto on a comparable basis, so for the international comparison we used reanalysis — a global model reconstruction of past weather, on a grid of roughly 25 km. A grid cell that size averages a city together with the fields around it, so it runs cooler than a thermometer standing in the middle of the city. That is why every city in this table, including the Japanese ones, reads low.
The comparison still holds, because the same understatement applies to every row. What you should not do is read a number out of this table and compare it with a number out of the first one. Compare within a table, not across.
What Japan built in order to survive it
Here is the part that does not appear in the climate tables, and it is the reason a lot of people end up loving the season they were warned about.
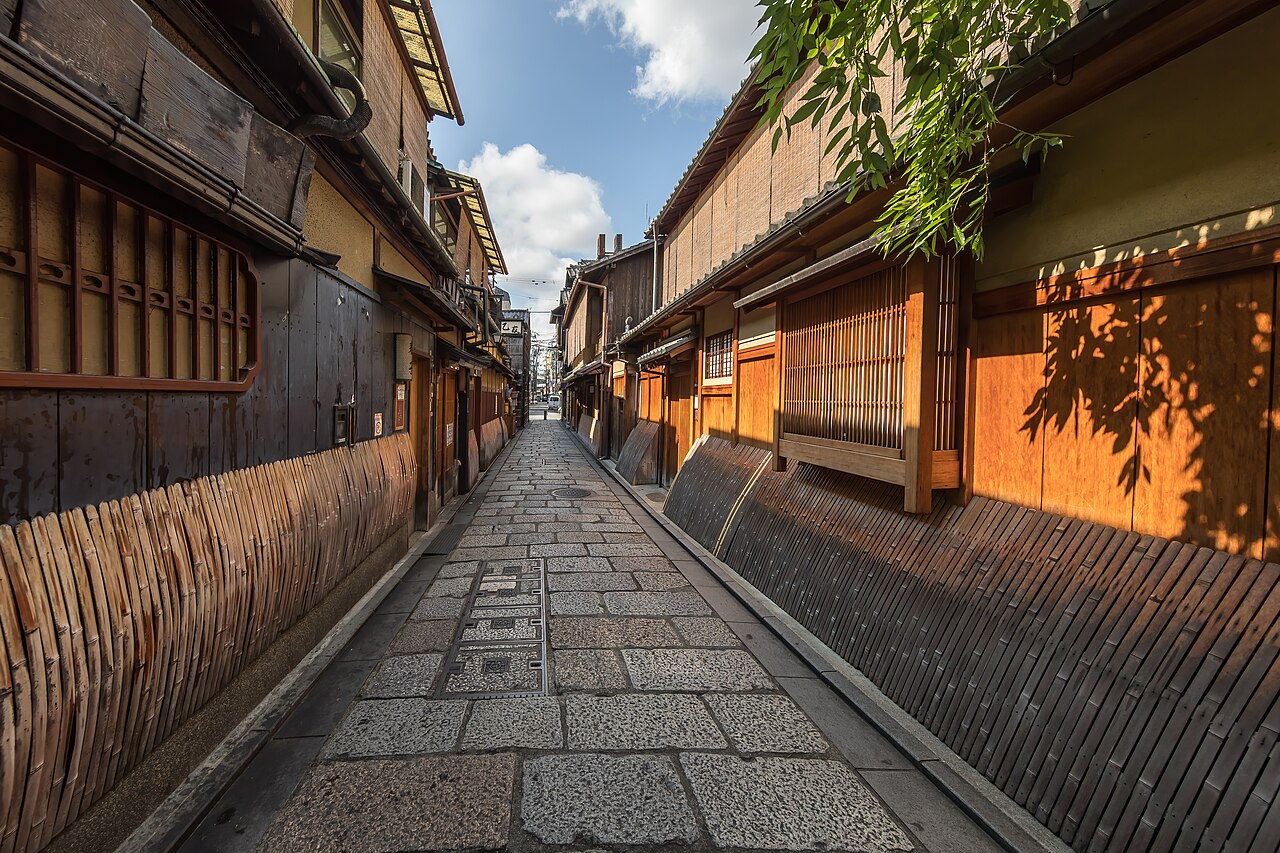
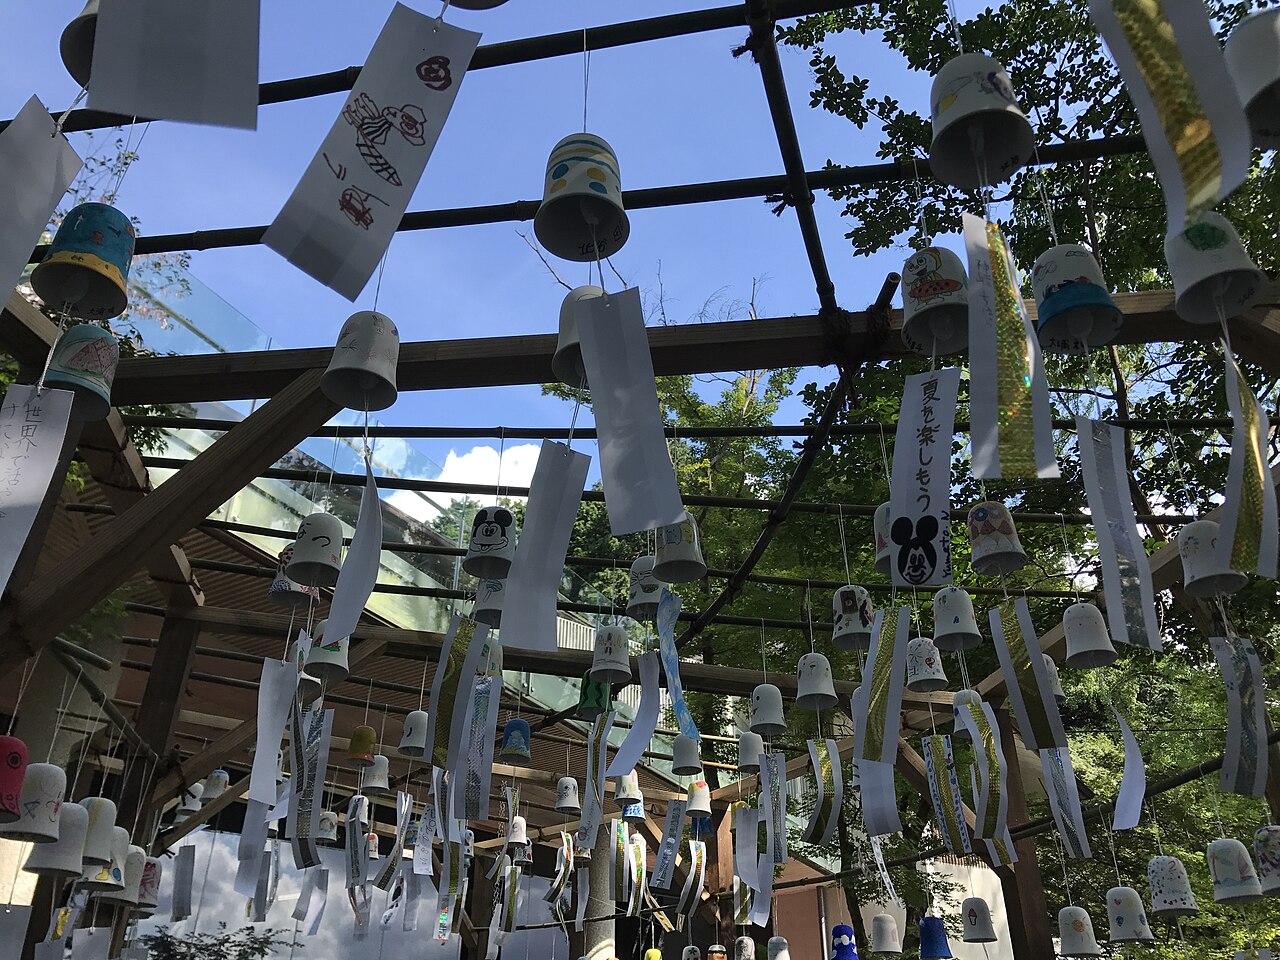
Japan has had these summers for a very long time and has spent that time building an entire material culture around them. Not decoration — equipment, most of it still in daily use, and most of it visible from any street in July.
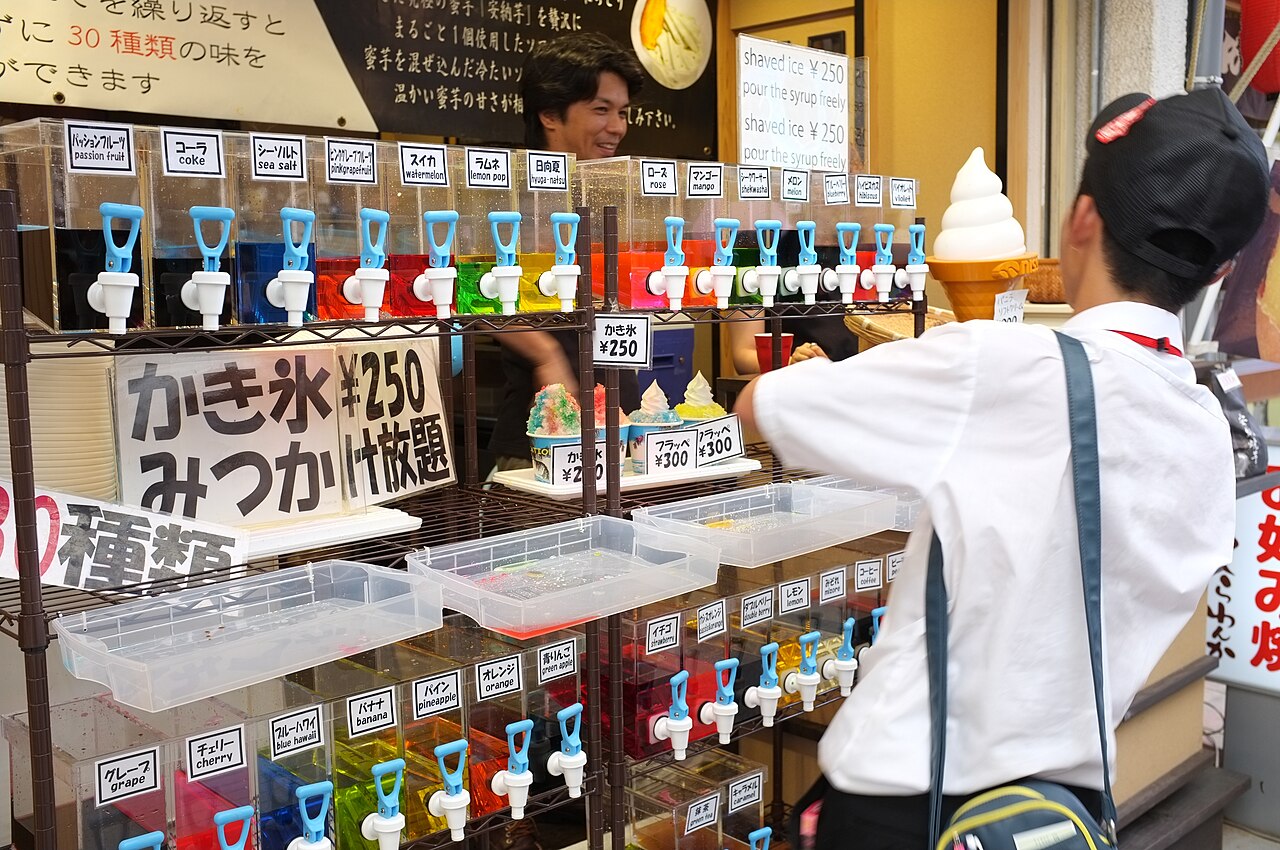
Then there is the food, which is organised around the same problem. Kakigori — shaved ice, not crushed — is sold from June through September from stalls that put out a single blue-and-white flag with the character for ice on it. When you see that flag you have found somewhere to sit down for four hundred yen.
Mugicha — cold roasted barley tea — is the default drink in the fridge of essentially every household between June and September, is caffeine-free, and costs about ¥200 for enough bags to make thirty litres. Vending machines change their stock over to cold in April and back in November. None of this is presented to visitors as culture. It is just what the country does when it gets hot.
And what it built in order to celebrate it
The strange thing about Japanese summer — the thing that catches people out — is that the worst-weather season is also the one with the most going on outdoors. Not in spite of the heat. Because of it: the evening is the only usable part of the day, so the country put everything in the evening.
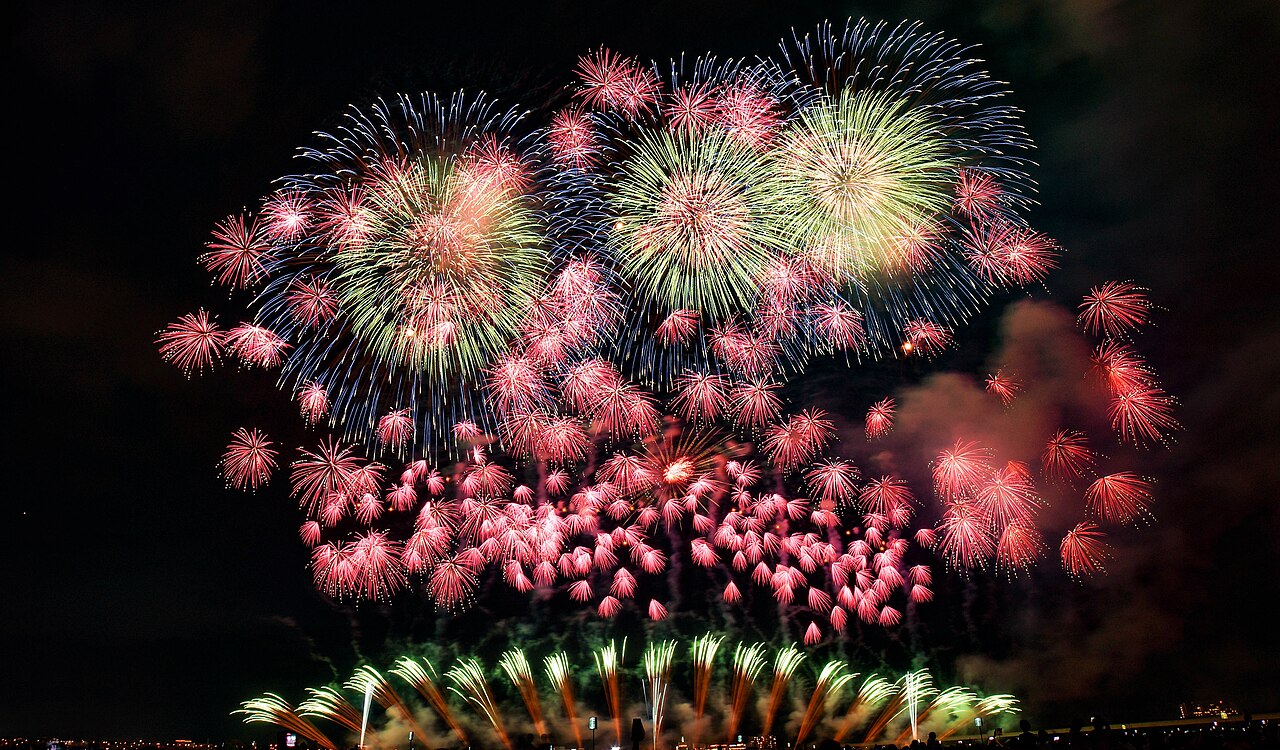
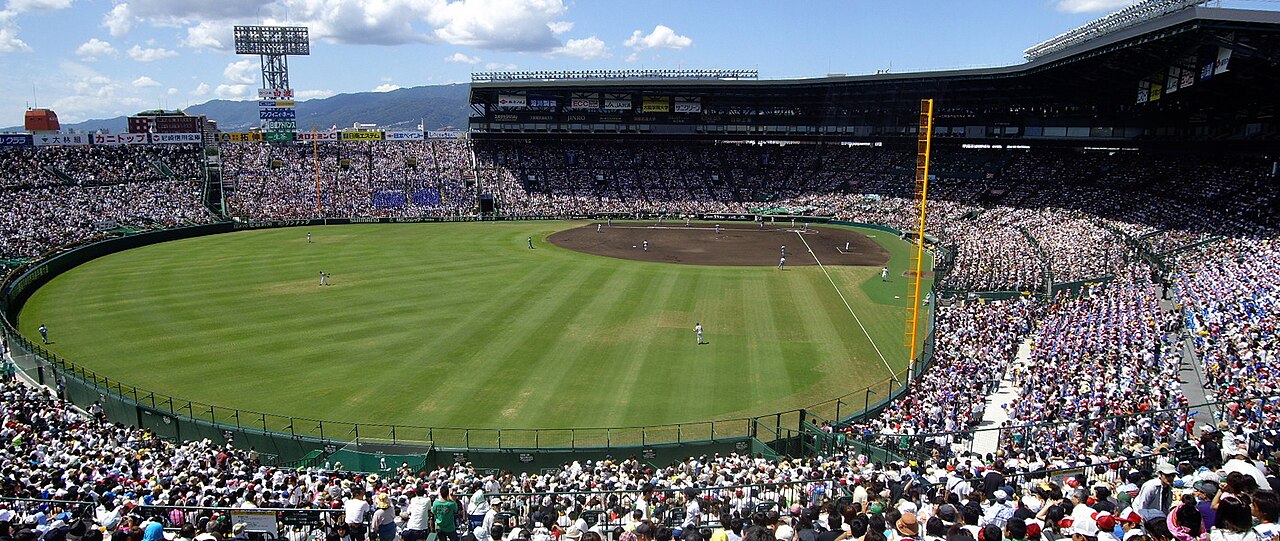
Add the neighbourhood bon odori — outdoor dances held in local parks in August, which anyone can join and nobody checks whether you know the steps — and the summer festivals that fill the streets of small towns for two or three nights each. Almost all of it is free, almost all of it is at night, and almost all of it happens in the six weeks a lot of guides tell you to avoid.
Japanese universities are on holiday from early August through most of September. If you enrol here, the hottest weeks of the year are also the ones with no classes in them.
What to take from this
- Ignore relative humidity when comparing cities. It falls as temperature rises, so the hottest cities post the lowest numbers. Kyoto reads 66% and holds more water than Sapporo at 75%.
- The night low is the number to look at. Osaka averages 25.8°C, Naha 26.8°C, and most of western Japan sits within a degree of 25°C. Half the nights are hotter than that.
- Confirm the air conditioner before you sign a lease, and ask whether it belongs to the room. This is the single most consequential thing on this page for your first year.
- Do not assume south means hotter. Naha's daytime high is 1.9°C below Kyoto's. Basins are hotter than islands.
- Whether this counts as hot depends on where you are now. Hanoi, Taipei, Dhaka and Bangkok are all more punishing in August than Kyoto is. Kathmandu is 5.4°C easier — and Nepal now sends the second-largest group of students in the country.
- Summer advice older than about ten years describes a cooler country. Tokyo's August nights have risen roughly 3°C over a century, and most of the English-language material about Japanese summers was written before the last decade of it.
- The season is not something to survive quietly. Fireworks, festivals and the baseball are all in these weeks, all in the evening, and the universities are closed for most of it.
Sources. Japan Meteorological Agency, climatological normals 1991–2020, monthly values by observation station (Sapporo, Sendai, Tokyo, Nagoya, Kyoto, Osaka, Hiroshima, Fukuoka, Naha), for mean daily maximum temperature, mean daily minimum temperature, mean relative humidity and mean vapour pressure. Past weather data search (Japanese). Tokyo's long series is from the same source, monthly values for August, 1875 to present. On the dew point column. The agency publishes vapour pressure, not dew point. We converted it with the Magnus formula, the standard approximation used for this purpose. Those dew point figures are our calculation, and any error in them is ours rather than the agency's; the vapour pressure values they were derived from are published. On the century comparison. The three block averages for Tokyo are ours, computed from published raw monthly observations, and are not the agency's homogenised normals. Tokyo's observation station moved from Otemachi to Kitanomaru in December 2014; we have made no adjustment for it. See the note above for which direction that bias runs. On the international table. Apparent temperature from ERA5 reanalysis (Copernicus Climate Change Service), retrieved through the Open-Meteo historical API and averaged by us over every August day from 1991 to 2020, one grid point per city. Reanalysis is a modelled reconstruction on a roughly 25 km grid, not a station record, and it reads cooler than a city-centre thermometer; the Japanese rows in that table are computed the same way for that reason. Those averages are our calculation. Student numbers by country are from JASSO's survey of international students enrolled as of 1 May 2025. One station per city. Each figure is from a single official station, not an average across the metropolitan area. A room three train stops away can differ, and inland suburbs typically run hotter than the city-centre station. Photographs. Every photograph on this page was taken by someone else and released under a licence permitting reuse — CC BY or CC BY-SA, via Wikimedia Commons. The photographer and licence are printed under each image, and the full list is at photo credits. We resize them and do nothing else to them. What this article is not. It is a description of recorded climate normals. It is not a forecast, and no individual summer will match a thirty-year average.
Next
77.7% of you will choose your room by price. 2.7% will think about who you might meet there
The city you pick costs you twice what the school does
Two in three international students fall ill in Japan. One in seven just waits it out
Half of you are worried about making friends. That is not the thing that goes wrong
Your situation is probably not in the averages
A thirty-year normal cannot tell you whether the room you are looking at has an air conditioner, or whether the city you are considering is the one that suits you. If that is the part you are stuck on, ask us one question and we will answer it from the records and the rules.
Ask one question →Free, once. No sales call afterwards.